
A Practical Guide to AI Report Writing

When you hear “AI report writing,” it’s not about just pushing a button and getting a perfect document. Think of it as a process where artificial intelligence helps you gather data, write the text, and organize everything into a report that actually makes sense. It’s about turning raw numbers—like last quarter’s sales figures or your team’s project updates—into clear, readable summaries. Done right, it saves professionals countless hours they’d otherwise spend manually piecing everything together.
The secret? Giving the AI clean data and crystal-clear instructions from the start.
Building Your AI Reporting Foundation

Before you even think about writing a prompt, you need to lay the groundwork. This isn’t just about picking a cool new tool; it’s about defining what you’re actually trying to accomplish. Remember, an AI is only as good as the information it’s given, which makes preparing your data the single most important part of this whole process.
The scope of your report will guide every decision you make. Are you whipping up a quick summary for the daily team stand-up, or are you crafting a detailed quarterly financial overview for stakeholders? Each of these goals demands a different approach to sourcing data, structuring the report, and telling the AI how deep to go with its analysis.
Define Your Reporting Goals
First things first, get specific about what this report needs to do. A vague goal will get you a generic, unhelpful report.
Don’t just say, “create a sales report.”
Instead, try something like: “Generate a weekly sales performance summary for the North American region, highlighting the top three performing products and flagging any products with a sales decline greater than 15%.”
That level of clarity immediately tells you which data points you need and where to find them, whether it’s in your CRM, a Google Sheet, or a project management tool.
Sourcing and Preparing Your Data
You’ve heard it before: garbage in, garbage out. That old programming mantra is more true than ever with AI. An AI can’t magically fix messy, inconsistent, or incomplete data—it will just spit those same flaws back out in its report.
Your data prep should include a few non-negotiable tasks:
- Cleaning Data: Hunt down and eliminate duplicate entries, fix typos, and standardize your formats. For instance, make sure all dates are in the same MM/DD/YYYY format.
- Structuring Information: Organize your data logically. A clean CSV or a well-structured table with clear column headers helps the AI understand the relationships between different data points.
- Ensuring Completeness: Scan for missing values that could throw off the entire analysis. If a daily sales figure is missing, the AI might just assume it was a day with zero sales, which could lead to some very wrong conclusions.
For example, a marketing team pulling together a campaign performance report has to make sure data from Google Analytics, their email platform, and social media ads all use consistent date ranges and metric names. Without that alignment, the AI-generated insights will be completely unreliable.
Before you dive in, it’s a good idea to run through a quick checklist to make sure you have all your ducks in a row.
AI Report Writing Readiness Checklist
| Component | Key Action | Why It Matters |
|---|---|---|
| Clear Objective | Write a one-sentence goal for the report. | A specific goal prevents generic, useless output from the AI. |
| Data Sources | Identify and list every source (e.g., CRM, Google Sheets). | Ensures you know where to pull information and can check for consistency. |
| Data Cleaning | Remove duplicates, fix errors, and standardize formats. | ”Garbage in, garbage out.” Clean data is essential for accurate results. |
| Data Structure | Organize data in a machine-readable format (CSV, table). | A logical structure helps the AI interpret the data correctly. |
| Tool Selection | Choose an AI platform that fits your report’s complexity. | The right tool (LLM vs. BI) matches your specific needs for text or visuals. |
Having these elements sorted out beforehand will save you a world of headaches and revisions later on.
Choosing the Right Platform
Once your goals are set and your data is clean, you can finally pick the right tool for the job. Your choice will really depend on how complex your report is and what kind of technical resources you have on hand.
You might go for a versatile Large Language Model (LLM) like GPT-4 or Gemini if you need flexible, natural-sounding summaries. On the other hand, a specialized Business Intelligence (BI) tool with built-in AI features can deliver powerful data visualizations and interactive dashboards. To really get a handle on this, it’s worth understanding the core ideas behind Generative BI. Taking a moment to read up on What Is Generative BI can provide some excellent context.
This foundational work—defining goals, cleaning data, and selecting tools—is not just a preliminary step. It is the core of effective AI reporting that prevents inaccurate outputs and wasted cycles down the line.
This strategic approach is quickly becoming the norm. In fact, 71.7% of content marketers now use AI to help outline their reports and documents, which shows a huge shift in how professional content gets made. If you want a head start, you can use a pre-built structure, like this handy daily work report template, to guide your data collection from the get-go.
Mastering Prompts for High-Quality Reports
The quality of your AI-generated report all comes down to a single thing: your prompt. It helps to think of the AI as a brilliant but incredibly literal junior analyst. If you give it a vague command like “write a sales report,” you’ll get an equally vague and generic summary back. But if you provide a detailed, well-structured prompt, you can get a draft that’s 90% of the way to being final.
This whole process is what we call prompt engineering, and honestly, it’s the most critical skill you can develop for writing reports with AI. It’s the art of clearly communicating exactly what you need so the model gives you precisely the output you want. Mastering this is about moving beyond simple questions and learning to craft detailed briefs that leave no room for misunderstanding.
The Anatomy of a Powerful Report Prompt
A truly effective prompt isn’t just a one-liner; it’s a comprehensive set of instructions. It gives the AI all the puzzle pieces it needs to build a solid, relevant document from the ground up.
For consistent results, I always break down my prompts into these key elements:
- Assign a Role: First, tell the AI who it is. “Act as a senior financial analyst.” This simple command frames its entire perspective, influencing its tone, vocabulary, and even how it interprets the data.
- Explain the Context and Goal: Give it the “why.” A quick line like, “You’re creating a monthly marketing performance report for the executive team to review campaign ROI,” sets the stage perfectly.
- Point to the Data Source: Be explicit about where the information is coming from. “Using the attached CSV file containing campaign data from January 1 to January 31…”
- Define the Structure and Format: This is where you dictate the exact layout. Don’t be shy about getting specific: “The report needs an Executive Summary, a section on Key Performance Indicators, and a final section for Recommendations. Use bullet points for the recommendations.”
- Specify the Tone of Voice: How should the report sound? Should it be formal and professional, or confident and data-driven? Tell the AI what you’re looking for.
When you combine these elements, you’re essentially handing the AI a complete blueprint. This dramatically cuts down on the back-and-forth and the need for heavy editing later.
The difference between a novice and an expert in AI report writing isn’t the tool they use, but the clarity and detail of the instructions they provide. A great prompt is a strategic document in itself.
From Vague to Valuable: An Example
Let’s look at a real-world example of how this plays out. A weak prompt is usually short and lacks any real direction, which leads to a generic, unhelpful mess.
Weak Prompt:
Write a report on our recent social media campaign.
This is far too open-ended. The AI has to guess the date range, the important metrics, the audience—you name it. The first draft will almost certainly be useless.
Now, let’s contrast that with a carefully engineered prompt that puts our principles into practice.
Powerful Prompt: `You are a marketing analyst preparing a performance report on the ‘Spring Launch 2024’ Instagram campaign. Using the attached data, create a report for the marketing director that covers the period from April 1 to April 30. The report should be formal and data-driven. Structure it with these sections:
- Executive Summary: A three-sentence overview of the campaign’s success.
- Key Metrics: A bulleted list showing Total Reach, Engagement Rate, and Click-Through Rate (CTR).
- Top Performing Posts: Identify the three posts with the highest engagement.
- Actionable Recommendations: Suggest two data-backed ideas for the next campaign.`
See the difference? This prompt provides the role, context, data, structure, and tone. The report it generates will be specific, organized, and immediately useful. If you want to dive deeper into crafting prompts like this, check out A Practical Guide to AI Prompt Engineering for High-Value Results.
Getting this right is more important than ever. Writing is already the most common use case for AI, with 51% of users using it for that purpose. However, public trust is shaky. For instance, only 11% of Americans feel good about AI writing news stories, which tells us there’s a huge demand for accuracy and human oversight. Crafting precise prompts is how we deliver that. You can read more about public perceptions of AI in professional tasks to understand why generating trustworthy outputs is so crucial.
Automating Your Reporting Workflow
Real efficiency with AI reports isn’t just about writing a draft faster. It’s about turning the whole thing into a hands-off system. When you connect the apps you live in every day—think Google Sheets, Notion, or Slack—to your AI, you can build powerful workflows that just run. You stop being the report creator and become the report receiver.
Tools like Zapier or Make are the secret sauce here. They act like a bridge between your apps, waiting for a “trigger” in one place to set off a chain reaction of “actions” elsewhere. For example, imagine a new lead lands in your CRM. That single event could kick off a workflow where an AI instantly analyzes their company data, writes up a personalized summary, and drops it into a Google Doc for the sales team.
Suddenly, reporting isn’t a chore you do once a week. It’s a live, continuous process humming along in the background.
Building Your First Automated Report Recipe
The trick to getting started with automation is to pick a simple, repetitive task you already do. What’s a report you have to create every single week? A project status update? A social media engagement summary? Maybe a sales pipeline review? These are perfect candidates for your first automated “recipe.”
Let’s walk through a classic example: pulling a weekly project update from a tool like Asana or ClickUp and piping it straight to your team in Slack.
Here’s how that would look:
- The Trigger: It all starts with a schedule. You’d set up your automation tool to run like clockwork—say, every Friday at 4 PM. This is what kicks everything off.
- The Data Grab: Next, the workflow connects to your project management tool’s API. It automatically pulls all tasks that were marked “completed” over the past seven days.
- The AI Handoff: This is where the real work gets done. All that task data gets sent to a large language model. Your prompt could be something like: “Summarize these completed tasks into a brief weekly project update. Group them by project and call out any high-priority items.”
- The Delivery: Finally, the AI-generated summary is formatted and posted directly into a specific Slack channel, like
#project-updates, giving the team an instant snapshot of the week’s progress.
This entire sequence runs without you lifting a finger, guaranteeing your team gets consistent, on-time updates. If you want to dive deeper into the nuts and bolts, it’s worth understanding the fundamentals of what is workflow automation and how it applies across different parts of a business.
By automating routine reports, you’re not just getting hours back in your day—you’re also slashing the risk of human error. Consistency gets baked right into the system, so data is never missed and deadlines are always hit.
The diagram below breaks down the core logic for any good prompt, which is really the engine driving these automated workflows.
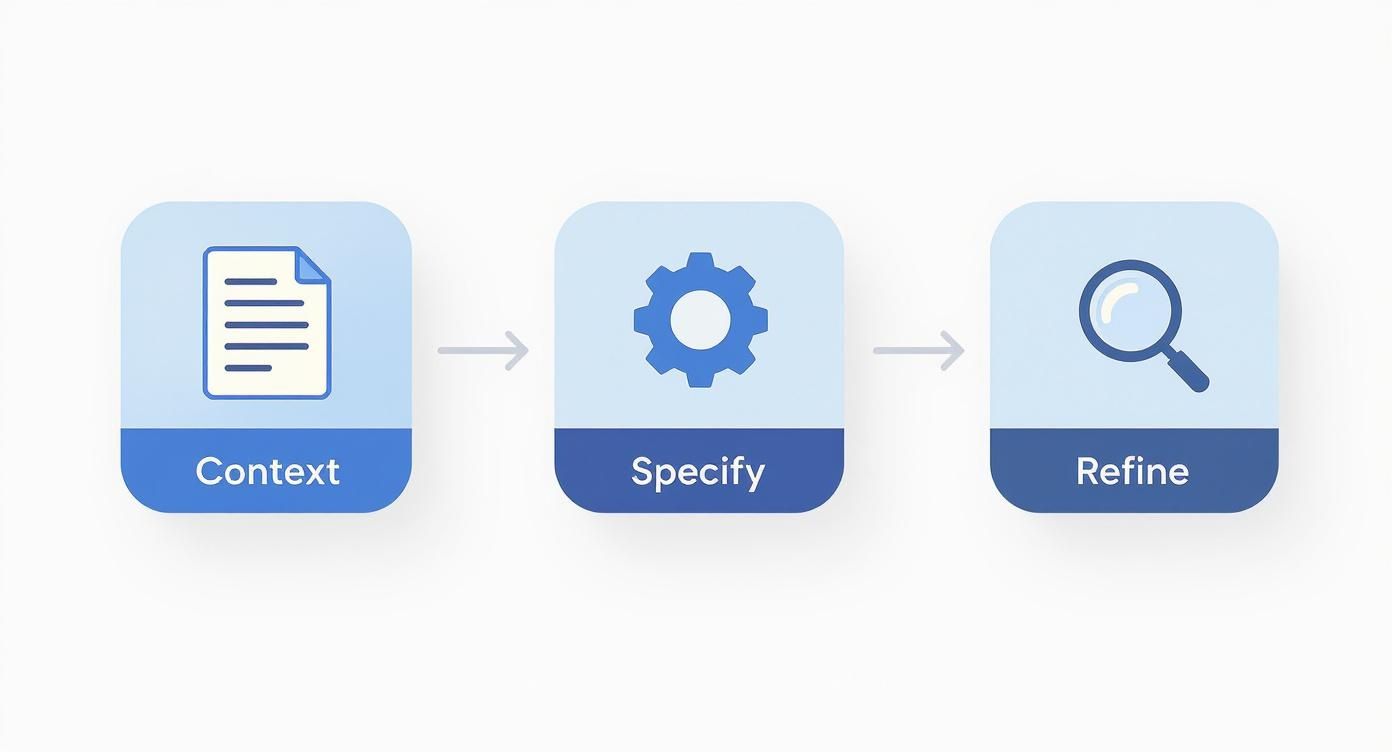
As you can see, a great report starts with rich context, followed by a crystal-clear request, and ends with a little refinement.
Expanding Your Automation Capabilities
Once you’ve nailed a basic recipe, you can start building more ambitious workflows. The sky’s the limit, but here are a few ideas I’ve seen work incredibly well:
- Automated Market Research: Set up a workflow to scrape industry news articles every morning. An AI can then summarize the key trends, flag any mentions of your competitors, and drop a daily briefing right into your inbox.
- Customer Feedback Analysis: Connect your automation tool to your help desk software or customer survey platform. Every time new feedback comes in, an AI can perform sentiment analysis, categorize the issue, and add a neat summary to a Notion database for the product team.
- Quick Financial Summaries: At the end of each month, trigger a workflow to pull transaction data from a Google Sheet. The AI can categorize all the spending, calculate totals, and draft a clean financial summary for you to review.
Each of these systems operates on the same simple principle: a trigger kicks off a data pull, the AI processes it, and the result is delivered where it needs to go. Once you master this pattern, you can start systematically eliminating the most tedious parts of your AI report writing.
Your Final Polish: The Human-in-the-Loop Review

Think of your AI as a brilliant but incredibly junior research assistant. It can assemble a first draft with lightning speed, but you—the expert—are still responsible for the final product. The single most important part of this entire process is the human-in-the-loop review.
This isn’t just about catching a typo. It’s about transforming a machine-generated document into a credible business asset that people can trust. Skipping this step is a massive gamble, one that can lead to flawed decisions and damaged credibility.
First, Verify Every Fact and Figure
Start with a healthy dose of skepticism. Treat every number, date, and statistic in the AI draft as a claim that needs to be proven. AI models can “hallucinate” information with unnerving confidence, so your job is to be the ultimate fact-checker.
Go back to your clean data sources and cross-reference every key data point. If the report says sales jumped 15%, pull up the original spreadsheet and confirm that exact number. This isn’t tedious; it’s essential. It’s the only way to build a foundation of trust for your report.
Look beyond the numbers and check the context. Did the AI correctly understand a metric? A simple mix-up between “revenue” and “profit” is a subtle but catastrophic error that could send your team in the completely wrong direction.
Hunt Down Hallucinations and Fix the Narrative
AI hallucinations aren’t just a quirky tech problem; they’re a real business risk. The number of publicly reported AI errors and biases has been climbing steadily. In 2024 alone, 233 such incidents were reported, a 56.4% increase from the year before. This trend, highlighted in recent research about the growing need for responsible AI practices, makes it crystal clear why you can’t just trust the output.
Here’s a practical checklist to guide your review:
- Read it Aloud: Does the story make sense? AI can write paragraphs that are individually fine but feel disjointed when read together. Reading it aloud is the fastest way to spot an illogical flow.
- Challenge Vague Language: Be on the alert for generic phrases like “significant growth” or “market trends indicate.” That’s often a sign the AI is hedging. Your job is to replace that fluff with hard numbers and concrete evidence.
- Scan for Contradictions: An AI might claim a project is on schedule in one section and then casually mention a critical delay a few pages later. These internal conflicts are red flags that need immediate attention.
Your expertise is the firewall against AI errors. The model provides the raw materials, but you are responsible for the structural integrity of the final report. Never delegate your critical thinking.
Add Your Expertise—The Part AI Can’t Do
This is where you truly earn your keep. The AI can summarize what happened, but it can’t explain why it happened or what to do next. That requires your experience, business sense, and strategic mind. This human touch is what elevates a simple data dump into a genuinely useful report.
As you review, actively look for places to inject your unique value:
- Strategic Insights: Go beyond the numbers. Why did that metric spike? Was it a marketing campaign, a seasonal trend, or a competitor’s misstep? Connect the dots for your reader.
- Actionable Recommendations: Based on everything in the report, what’s the next move? Propose clear, concrete steps the team should take.
- Your Personal Take: Don’t be afraid to add your own perspective. A simple phrase like, “From my perspective, this data suggests…” immediately adds a layer of human authority and builds trust.
To make it clear where the AI stops and you begin, here’s a simple breakdown of the roles in this new partnership.
AI vs Human Roles in Report Creation
The table below outlines which tasks are perfectly suited for AI automation and which absolutely require your human expertise.
| Task | Best for AI | Best for Human |
|---|---|---|
| Data Aggregation | Excellent for pulling and structuring raw data from multiple sources. | Best for verifying the final aggregated numbers are correct and complete. |
| Initial Drafting | Quickly generates the first version of the report based on a solid prompt. | Responsible for refining the narrative, ensuring a logical flow, and adding tone. |
| Summarization | Can condense large datasets into concise, readable paragraphs. | Adds the crucial context and strategic interpretation to any summary. |
| Strategic Analysis | Limited; it can spot patterns but lacks true business context. | The only reliable source for deep analysis and actionable insights. |
| Final Review | Can perform basic grammar and spell checks. | Accountable for factual accuracy, nuance, tone, and overall quality. |
Ultimately, the best AI-assisted report is a true collaboration. By rigorously reviewing and refining the AI’s output, you get the best of both worlds: the machine’s incredible speed combined with your irreplaceable intelligence. The result is a final product that is not only produced faster but is more accurate and insightful.
Taking Your AI Reports to the Next Level
Once you’ve got the hang of the basics, it’s time to get into the really interesting stuff. We’re moving beyond simple prompts and into techniques that can make your AI-generated reports genuinely exceptional. This is where you graduate from just using AI to building a smart, customized reporting engine for your business.
The aim here is to create reports that are not only produced faster but are also more insightful and consistent than what you’d get from a generic tool. Think of it as building an AI assistant that truly gets your business, understands your company’s voice, and can interpret data with a level of nuance that feels human. This is how you turn a neat automation trick into a real competitive edge.
Fine-Tuning a Model to Match Your Brand
One of the most powerful things you can do is work with fine-tuned AI models or custom GPTs. Instead of relying on a public model that knows a little about everything, you can train a private version on your own data. This means feeding it your company’s past reports, style guides, and internal memos—dozens or even hundreds of them.
What you get is an AI that already knows your preferred tone, formatting, and industry-specific terms. Imagine a financial services firm training a model on all its past quarterly earnings reports. The AI will learn to automatically adopt that formal, precise language and follow specific disclosure rules. This cuts down editing time dramatically and keeps your brand voice perfectly consistent.
There are some big wins with this approach:
- A Consistent Voice: The AI learns to write like you, whether your style is casual and chatty or buttoned-up and academic.
- Domain-Specific Smarts: By training it on your stuff, the model picks up your internal jargon, product names, and key metrics, leading to fewer weird phrases or factual slip-ups.
- Simpler Prompts: When the model already knows your style guide by heart, you can write shorter prompts that focus on the new data and analysis, not on repeating formatting commands.
Teaching AI to Read Charts and Graphs
Modern reports are more than just text—they’re a mix of words, charts, graphs, and tables. This is where multi-modal AI tools come in. These are the models that can actually “see” a bar chart or a line graph, pull out the key numbers, and then write a narrative about what they mean.
For example, you could upload a screenshot of your website traffic dashboard. A multi-modal AI can spot the traffic spike in the third week, connect it to a marketing campaign listed in a nearby table, and write something like, “The recent 25% jump in site visits was likely driven by the new social media campaign.”
This ability to pull together insights from both visual and text-based sources is a game-changer. The AI starts to generate narratives that feel much more complete and context-aware, a lot like how a human analyst would connect the dots.
This is especially useful for creating quick summaries directly from dashboards or slide decks. It closes the gap between seeing the data and explaining the insight. If you’re looking to upgrade your whole workflow, it’s worth checking out other AI tools for productivity that can work alongside your reporting efforts.
Integrating AI Directly into Business Intelligence Platforms
The real cutting edge of AI reporting is happening inside modern Business Intelligence (BI) platforms. Tools like Tableau, Microsoft Power BI, and Looker are now building natural language generation (NLG) right into their dashboards. This integration lets you go from looking at data to telling a story with it, all in one place.
Instead of staring at a sales dashboard and typing up your own summary, you can now just ask the BI tool a question: “What were the main drivers of revenue growth last quarter?” The platform’s built-in AI crunches the numbers, finds the most important trends, and spits out a clear, written summary right there next to the charts.
This creates a smooth workflow where exploring data and writing the report happen at the same time. It gives everyone on your team the power to generate smart, data-backed narratives with a simple question, no data science degree required. The AI becomes your on-demand analyst, ready to explain the “so what” behind the numbers whenever you need it.
Common Questions About AI Report Writing
As soon as teams start playing around with AI for their reporting, the same questions always pop up. It’s totally normal. Getting these sorted out early on is the best way to make sure everyone feels comfortable and knows what they’re doing. Let’s tackle the big ones.
Is It Safe to Use Confidential Data?
This is usually the first question, and for good reason. The short answer is: it depends entirely on the tool you’re using.
If you’re just messing around with the free, public version of a tool like ChatGPT, you should assume your data could be used for training. That’s a huge red flag for anything sensitive.
But when you move up to enterprise-level platforms or paid API services, the game changes. Most of these have much tighter privacy policies, often guaranteeing your data stays your data and isn’t used to train their models. For maximum security, you can look for tools with zero data retention or even on-premise AI models that run on your own infrastructure.
My go-to advice? Just get in the habit of anonymizing your data before you upload it anywhere. Strip out names, specific locations, and anything else that could identify a person or company. It’s a simple step that solves a lot of problems.
How Can I Ensure Factual Accuracy?
You can’t. At least, not without a human in the loop. You should never, ever trust an AI-generated report without putting a pair of eyes on it. The best way to avoid issues is to give the AI the exact data you want it to analyze, rather than letting it pull information from the web.
Think of your prompt as your first line of defense. Be crystal clear. Tell the AI to only use the data you’ve provided. I often add a line like, “Base all conclusions and statistics strictly on the attached CSV file and nothing else.”
Then comes the human review—this part is non-negotiable.
- Spot-check the big numbers: Every major data point needs to be cross-referenced with your original source. No exceptions.
- Challenge fuzzy language: If the AI says something vague like “sales improved,” push back. Make it give you the exact percentage.
- Double-check the context: Did the AI mix up revenue and profit? It happens. Make sure it understood the metrics correctly.
This back-and-forth between you and the AI is the only way to be confident in the final report’s integrity.
Which AI Tools Create Charts and Graphs?
A standard language model is great with words, but for visuals, you’ll need something more specialized. Honestly, the best reports often come from a mix of tools.
Your first option is to look at the big Business Intelligence (BI) platforms like Microsoft Power BI or Tableau. They’ve been baking AI features into their software for a while now, letting you generate text summaries that explain the charts and dashboards you build.
Another route is to use newer, AI-first data analysis tools. With these, you can often just upload a spreadsheet and type a plain-English command like, “Create a bar chart showing sales by region for Q2.” The AI spits out the visual for you. A great workflow is using one of these to generate the charts and then feeding them to a language model to write the narrative that ties it all together.
Ready to stop repetitive busywork and reclaim hours each week? Sagekit turns simple chat conversations into powerful, automated workflows that connect all your favorite apps. Build your first workflow for free.